About
Here you’ll find some basic information about me.
I’ve included a quick ggplot2 chart (my favorite graphing library) of places I’ve lived in my life.
shhhh <- suppressPackageStartupMessages

shhhh(library(tidyverse))
shhhh(library(ggplot2))
shhhh(library(dplyr))
shhhh(library(mapproj))
df <- read.csv('https://raw.githubusercontent.com/Landcruiser87/Andy_Heroy_Data_Science/gh-pages/data/Livingspaces.csv')

colnames(df) <- c("Place","City","State","Lat","Long","Year","cnt")

states <- map_data("state")
ggplot(data = states) +
 geom_polygon(data = states, aes(x=long, y = lat, color="grey", group = group), alpha=.2, color="white") +
 geom_point(data=df, aes(x=Long, y=Lat, size=cnt, color=cnt)) +
 geom_text(data=df, aes(x=Long, y=Lat,label=City), size=3, nudge_x=0, nudge_y=1.3, check_overlap = T) +
 coord_map() +
 guides(scale="none") +
 labs(title="Where I've called home",color="years") +
 scale_size_continuous(guide = "none") +
 theme(legend.position = c(0.9,0.3))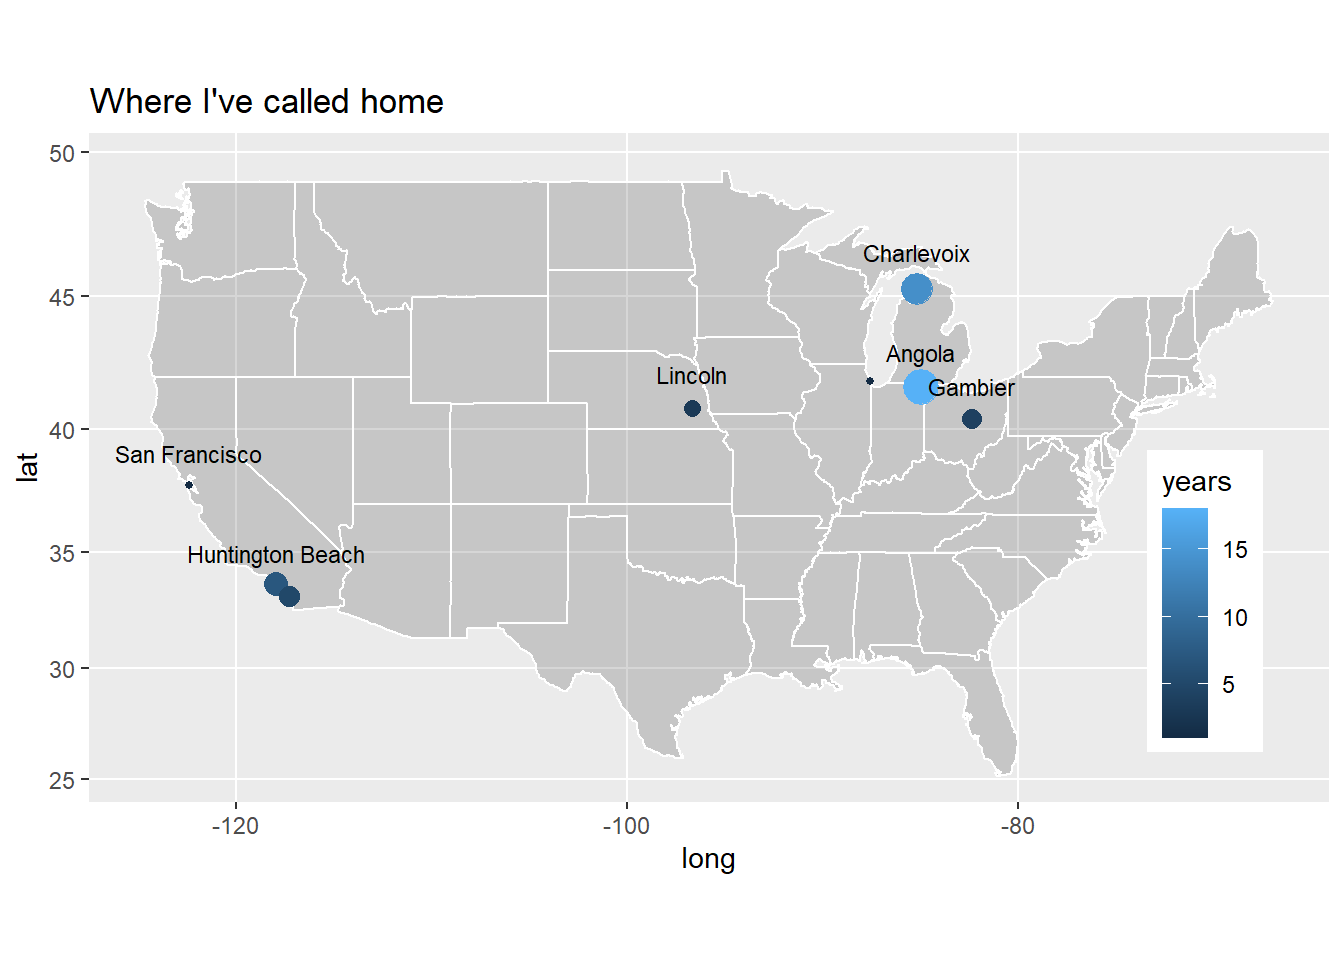
Things that pique my interest/take up my time.
- Object Oriented Python
- Machine Learning
- Signal Processing
- Deep Learning
- Fighting covid through Data Science
- Visualizations
- Database Administration
- Golf
- Travel
- Home Exercise
- Rhodesian Ridgebacks
Brief Timeline
- 2004 - Graduate from Kenyon College with BA in Physics
- 2004 - Work for a Toyota Atlantic Race Team in San Francisco
- 2007 - New job at Cleveland Golf in Huntington Beach, CA
- 2011 - New job at Titleist and move to Carlsbad, CA
- 2015 - New job at Cobra-Puma Golf in Carlsbad, CA
- 2018 - Move to Nebraska and start graduate school at SMU in Data Science
- 2020 - Graduate SMU and move to Northern Michigan
- 2020 - Begin Job with US Air Force analyzing ECG data
- 2021 - Begin Job with USUHS